
Tuesday, September 30, 2014

Monday, September 29, 2014
FOREX THEORY
Types of Breakouts
When trading breakouts in forex,
it is important to realize that there are two main types:
1.Continuation breakouts
2.Reversal breakouts
Knowing what type of breakout you
are seeing will help you make sense of what is actually happening in the big
picture of the market.
Breakouts are significant because
they indicate a change in the supply and demand of the currency pair you are
trading. This change in sentiment can cause extensive moves that provide
excellent opportunities for you to grab some pips.

QUOTE OF THE DAY
"Do not wait to strike till the iron is hot; but make
it hot by striking."
By William Butler Yeats.

Thursday, September 25, 2014
"YOUR WEALTH IS OUR HEALTH"
HOW DO I RECEIVE ADDITIONAL TRADING AND TECHNICAL SUPPORT?
You can contact us through:
Mobile: +6012 299
0776 / +6012 477 0776
Facebook: www.facebook.com/sslfxguru
Twitter: www.twitter.com/sslfxguru
Skype: sslfxguru
E-mail: drhari@sslfxguru.com
Website: www.sslfxguru.com


Wednesday, September 24, 2014
FOREX THEORY
How to Measure Volatility
3. Average True Range (ATR)
Last on the list is the ATR.
The ATR is an excellent tool for measuring volatility
because it tells us the average trading range of the market for X amount of
time, where X is whatever you want it to be.
So if you set ATR to 20 on a daily chart, it would show you
the average trading range for the past 20 days.
Use ATR to measure price volatility.
When ATR is falling, it is an indication that volatility is
decreasing. When ATR is rising, it is an indication that volatility has been on
the rise.


Tuesday, September 23, 2014

Monday, September 22, 2014
FOREX THEORY
How to Measure Volatility
2. Bollinger Bands
Bollinger bands are excellent
tools for measuring volatility because that is exactly what it was designed to
do.
Bollinger bands are basically 2
lines that are plotted 2 standard deviations above and below a moving average
for an X amount of time, where X is whatever you want it to be.
So if we set it at 20, we would
have a 20 SMA and two other lines. One line would be plotted +2 standard
deviations above it and the other line would be plotted -2 standard deviations
below.
When the bands contract, it tells
us that volatility is low.
When the bands widen, it tells us
that volatility is high.

QUOTE OF THE DAY
"Change your life today. Don’t gamble on the future,
act now, without delay."
By J. Simone de Beauvoir.

Friday, September 19, 2014
FOREX THEORY
1. Moving Average
Moving averages are probably the
most common indicator used by forex traders and although it is a simple tool,
it provides invaluable data.
Simply put, moving averages
measures the average movement of the market for an X amount of time, where X is
whatever you want it to be.
For example, if you applied a 20
SMA to a daily chart, it would show you the average movement for the past 20
days.
There are other types of moving
averages such as exponential and weighted, but for the purpose of this lesson
we won’t go too much in detail on them.
For more information on moving
averages or if you just need to refresh yourself on them, check out our lesson
on moving averages.


Wednesday, September 17, 2014
FOREX THEORY
How to Measure
Volatility
Volatility is
something that we can use when looking for good breakout trade opportunities.
Volatility measures
the overall price fluctuations over a certain time and this information can
be used to detect potential breakouts.
There are a few
indicators that can help you gauge a pair’s current volatility. Using these
indicators can help you tremendously when looking for breakout opportunities.
 |
QUOTE OF THE DAY
"The key is to keep company only with people who uplift
you, whose presence calls forth your best."
By Epictetus.

Tuesday, September 16, 2014
QUOTE OF THE DAY
"You are never too old to set another goal or to dream
a new dream."
By C. S. Lewis.

Monday, September 15, 2014
FOREX THEORY
Volatility, Not Volume
You’ll notice that unlike trading
stocks or futures, there is no way for you to see the volume of trades made in
the forex market.
With stock or future trades,
volume is essential for making good breakout trades so not having this data
available in the forex leaves us at a disadvantage.
Because of this disadvantage, we
have to rely not only on good risk management, but also on certain criteria in
order to position ourselves for a good potential breakout.
If there is large price movement
within a short amount of time then volatility would be considered
high.
On the other hand, if there is
relatively little movement in a short period of time then volatility would be
considered low.
While it’s tempting to get in the
market when it is moving faster than a speeding bullet, you will often find
yourself more stressed and anxious; making bad decisions as your money goes in
and then goes right back out.
This high volatility is what
attracts a lot of forex traders, but it’s this same volatility that kills a lot
of them as well.
The goal here is to use volatility
to your advantage.
Rather than following the herd and
trying to jump in when the market is super volatile, it would be better to look
for currency pairs with volatility that is very low.
This way, you can position
yourself and be ready for when a breakout occurs and volatility skyrockets!

QUOTE OF THE DAY
"Do you want to know who you are? Don’t ask. Act!
Action will delineate and define you."
By Thomas Jefferson.

Friday, September 12, 2014
FOREX THEORY
How to Trade Breakouts
What are breakouts and how can I
take advantage of them?
Unlike the breakouts you might have
had as a teenager, a breakout in the trading world is a little different!
A breakout occurs when the price
“breaks out” (get it?) of some kind of consolidation or trading range.
A breakout can also occur when a
specific price level is breached such as support and resistance levels, pivot
points, Fibonacci levels, etc.
With breakout trades, the goal is
to enter the market right when the price makes a breakout and then continue to
ride the trade until volatility dies down.

QUOTE OF THE DAY
"When god blesses you financially, don’t raise your
standard of living. Raise your standard of giving."
By Mark Batterson.

Thursday, September 11, 2014
"YOUR WEALTH IS OUR HEALTH"
HOW DO YOU RECEIVE THE TRADE SIGNALS AND UPDATES?
We will alert you to trade by sending signals via SMS.

QUOTE OF THE DAY
"Pursue one great decisive aim with force and
determination."
By Carl Von Clausewitz.

Wednesday, September 10, 2014
FOREX THEORY
Conclusion
You don’t have to be shot down by the “Smooth Retracement”.
You don’t have to lose all those pips.
And you most certainly don’t need to
wear pink arm floaties (although if pink’s your favorite color, it’s okay – we
don’t judge).
Just know how to distinguish retracements from reversals.
This is part of growing up as a trader. Having the ability to do so will
effectively reduce your losses and prevent winners from turning into losers.
With lots of practice and experience, you’ll find yourself
being able to trade accordingly to retracements and exit with a profit more
times than not.
.jpg)
QUOTE OF THE DAY
"There are no secrets to success. It is the result of
preparation, hard work and learning from failure."
By Collin Powell.
.jpg)
Tuesday, September 9, 2014
QUOTE OF THE DAY
"Ships in harbour are safe, but that’s not what ships
are built for."
By John Shedd.

Friday, September 5, 2014
FOREX THEORY
Protect Yo Self From Reversals
Whenever Happy Pip goes swimming at
the beach or the pool, she always wears her hot pink rubber ducky floaters.
Whenever she trades retracements, she uses stop loss points.
Pink rubber ducky floaters are life
savers. Stop loss points are capital savers.
As we said before, reversals can
happen at any time. Retracements can turn into reversals without warning.
This makes using trailing stops in
trending markets very important. With trailing stop loss points, you can
effectively prevent yourself from exiting a position too early during a
retracement and exit a reversal in a pinch.


Thursday, September 4, 2014
QUOTE OF THE DAY
"No matter what people tell you, words and ideas can
change the world."
By Robin Williams.

Wednesday, September 3, 2014
FOREX THEORY
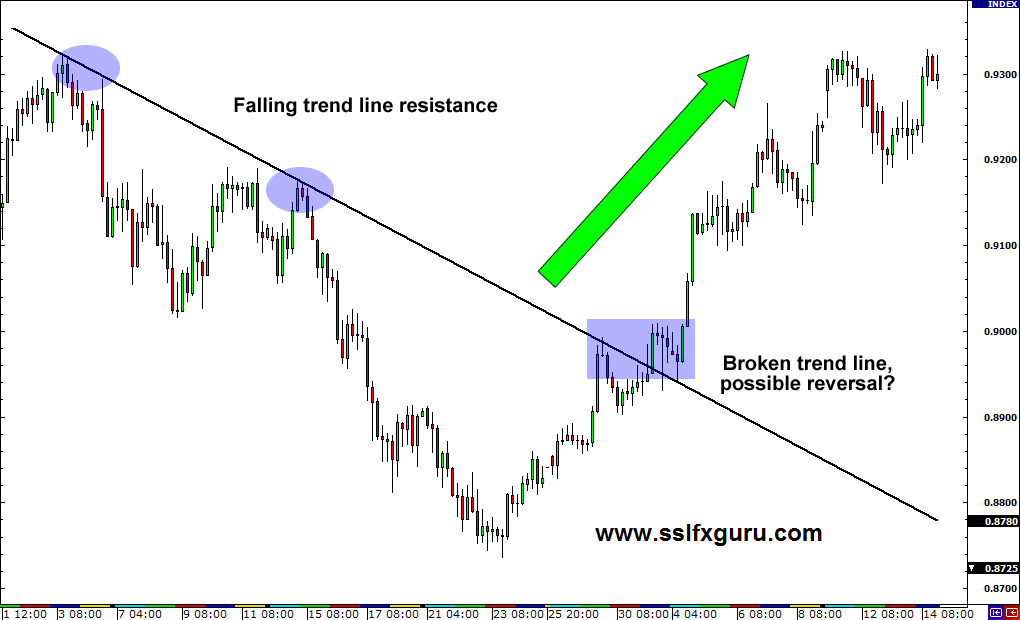
Identifying Retracements Part 3
The last method is to use trend lines. When a major trend
line is broken, a reversal may be in effect.
By using this technical tool in conjunction with candlestick
chart patterns discussed earlier, a forex trader may be able to get a high
probability of a reversal.
While these methods can identify reversals, they aren’t the
only way. At the end of the day, nothing can substitute for practice and
experience.
With enough screen time, you can find a method that suits
your forex trading personality in identifying retracements and reversals.
Tuesday, September 2, 2014
QUOTE OF THE DAY
"Good things come to those who believe, better things
come to those who are patient and the best things come to those who don’t give
up."
By Unknown Author.

Monday, September 1, 2014
FOREX THEORY
Identifying Retracements Part 2
In an uptrend, traders will look
at the lower support points (S1, S2, S3) and wait for it to break. In a
downtrend, forex traders will look at the higher resistance points (R1, R2, R3)
and wait for it to break.
If broken, a reversal could be in
the making! For more information or another refresher, check out the Pivot
Points Lesson!

QUOTE OF THE DAY
"I believe that every single day people are offered the
chance to make the best possible decision about everything they do."
By Paulo Coelho.

Subscribe to:
Posts (Atom)